MyPlate Pyramid and Individuality
MyPlate is a nutrition guide provided by the USDA that replaced the MyPyramid in 2013. It is a basic guide on what percentage of your diet should come from carbohydrates and protein. Many of us can remember the food guide pyramid that started in 1992 that was very misguiding in its later years. The MyPlate is a more current, up to date guide that is based on current research, and provides an easier understanding of how to eat healthy, but overlooks the importance of fat in one’s diet.
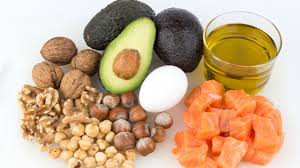
MyPlate is divided into sections of 30 percent grains, 40 percent vegetables, 10 percent fruits and 20 percent protein, accompanied by a smaller group that includes dairy. The old Food Guide Pyramid from years ago consisted of a diet that was roughly 6-11 servings of bread, cereal, rice (think starchy carbohydrates), 2-4 servings of vegetables, 2-4 servings of fruit, 2-3 servings of dairy, 2-3 servings of meat, eggs, poultry, fish, eggs, and nuts, and lastly at the top was fats, oil, and sweets used sparingly. As you can see, the new approach with MyPlate is a much more intelligent guide to eating based on current research. The one thing missing from this newer guide is the importance of fat (mainly healthy fats) in our diet which is proving to be very beneficial for things such as skin, eyesight, brain health, combat heart disease, help maintain healthy hormone levels, create better satiety in your gut, maintain better blood sugar control, as well as decrease inflammation in your body. In my opinion fat should consist of 30-50% of one’s diet depending on energy expenditure which is what we will talk about next.
The percent of what foods we consume is all based on how active we are. If you live an extremely sedentary life, then there is no need to consume that many carbohydrates at all. In fact, I would take that percent as low as 20%. On the extreme end, if you exercise 2 hours daily (think endurance athletes, gymnasts) then your carbohydrate percent might be as high as 50%!
Where do you fit in this range? The answer to this question is part science and part art, but I came up with a good scale to use that applies to most of us. A few things to keep in mind is this scale DOES NOT factor in anyone that is trying to lose weight, individual health concerns or diseases people have, past history success with food choices, and changes in exercise habits.
I split the scale into 3 groups- extremely active, moderately active, sedentary
- extremely active group- exercises 10 or more hours a week- 50% carbs/ 30% fats/ 20% protein
- moderately active group-exercises 4-10 hours a week- 40% carbs/ 30% fats/ 30% protein
- sedentary group- little to no exercise- 0-3 hours a week- 20% carbs/ 50% fats/ 30% protein
This is a very basic chart, but I have found works great for MOST PEOPLE. Like I mentioned above, what and how much of certain foods is very individual. Having someone with current knowledge of nutrition trends on up to date research can do wonders for your health. The changes that have come about since the inception of the Food Guide Pyramid have been positive, but these changes need to be updated every 1-2 years to stay current. Also bear in mind any kind of change in your own diet must be a GRADUAL and you should take a LONG-TERM approach to it so it becomes a way of life instead of a “quick-fix.”